Fig. 7
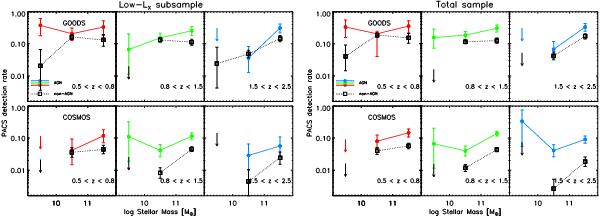
PACS detection rate in the different redshift bins, increasing from left to right, for the low-LX subsample (left) and for the total one (right). The GOODS fields are represented in the upper panels and COSMOS in the lower ones. AGN hosts are showed as coloured solid lines and circles, inactive galaxies are represented by black dotted lines and open boxes. 1σ uncertainties are derived through binomial statistics. Masses indicate the centre of each mass bin. Upper limits indicate cases where none of the galaxies is detected by PACS. Detection in all PACS bands is required.
Current usage metrics show cumulative count of Article Views (full-text article views including HTML views, PDF and ePub downloads, according to the available data) and Abstracts Views on Vision4Press platform.
Data correspond to usage on the plateform after 2015. The current usage metrics is available 48-96 hours after online publication and is updated daily on week days.
Initial download of the metrics may take a while.