Fig. 6
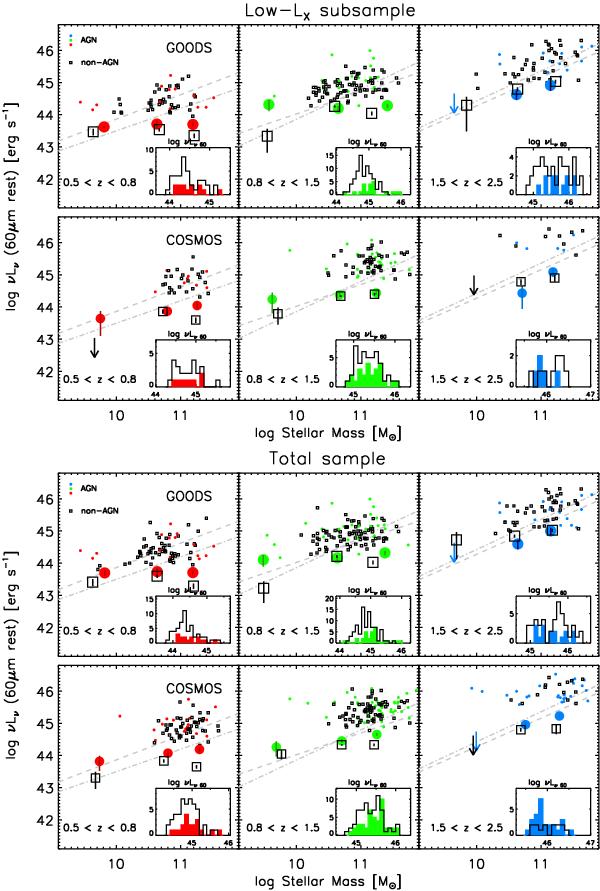
νLν(60 μm) versus stellar mass in the different redshift bins, for the low-LX subsample (top) and for the total one (bottom). The GOODS fields are represented in the upper panels and COSMOS in the lower ones. Coloured solid circles and black open boxes show AGN hosts and inactive galaxies, respectively. Small symbols refer to individual PACS detections, while large ones indicate the stacked values (for sources undetected in at least one PACS band). Error bars on the stacked values are computed by bootstrapping. Stellar masses for stacked sources reflect the median masses of non detected sources in each mass and redshift interval. In the two GOODS fields, stacked luminosities and stellar masses were averaged and weighted with the number of sources. Main sequence relations (grey curves) are as in Fig. 5. The inset panels show the logarithmic νLν(60 μm) distribution for PACS detected AGN hosts (coloured solid histograms) and inactive galaxies (black plain ones).
Current usage metrics show cumulative count of Article Views (full-text article views including HTML views, PDF and ePub downloads, according to the available data) and Abstracts Views on Vision4Press platform.
Data correspond to usage on the plateform after 2015. The current usage metrics is available 48-96 hours after online publication and is updated daily on week days.
Initial download of the metrics may take a while.