Fig. 5
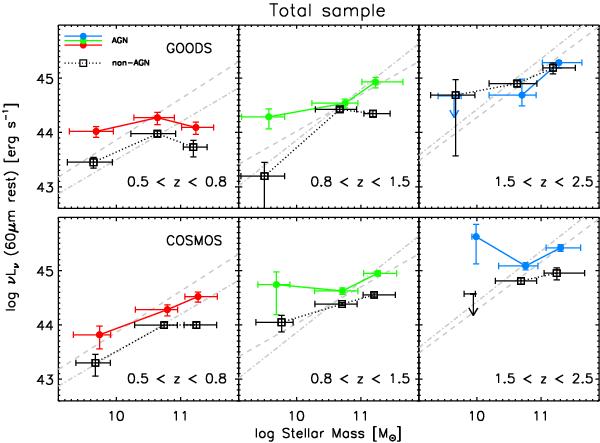
Average νLν(60 μm), proportional to the SFR, versus stellar mass in the different redshift bins, increasing from left to right, for the GOODS fields (upper panels) and COSMOS (lower panels). Coloured solid lines/solid circles and black dotted lines/open boxes show AGN hosts and inactive galaxies, respectively. Stellar mass values reflect the median in each mass and redshift interval, and their error bars show the 80% confidence intervals. Error bars on νLν(60 μm) were computed by bootstrapping (see text). Grey dashed lines represent the main sequences as inferred by Santini et al. (2009) in redshift bins similar to the ones used in this work, while dot-dashed ones are the results of Noeske et al. (2007), Elbaz et al. (2007) and Daddi et al. (2007b) respectively at z ~ 0.5, z ~ 1 and z ~ 2. At all masses and redshifts, with the exception of the highest redshift interval in the GOODS fields, AGN hosts show an enhanced FIR emission with respect to inactive galaxies of similar stellar mass. In contrast, the locus of AGN hosts is broadly consistent with the main sequence of (only) star forming galaxies.
Current usage metrics show cumulative count of Article Views (full-text article views including HTML views, PDF and ePub downloads, according to the available data) and Abstracts Views on Vision4Press platform.
Data correspond to usage on the plateform after 2015. The current usage metrics is available 48-96 hours after online publication and is updated daily on week days.
Initial download of the metrics may take a while.