Fig. 3
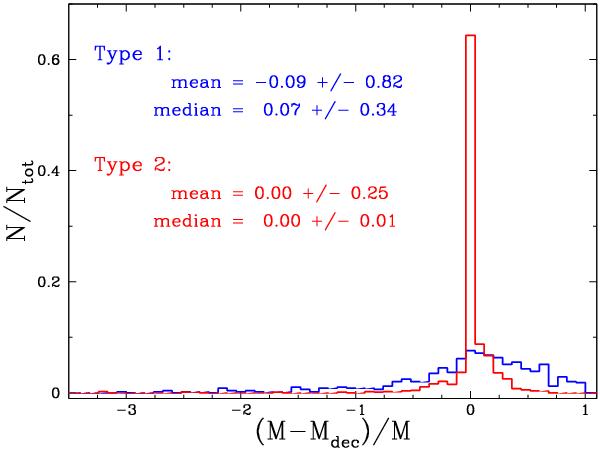
Normalized distributions of the relative difference between the stellar mass estimates when using pure stellar templates (M) and the decomposition method (Mdec). Blue and red histograms represent the total sample of Type 1 and Type 2, respectively. We report the mean/median values and standard deviation/semi-interquartile range of each sample.
Current usage metrics show cumulative count of Article Views (full-text article views including HTML views, PDF and ePub downloads, according to the available data) and Abstracts Views on Vision4Press platform.
Data correspond to usage on the plateform after 2015. The current usage metrics is available 48-96 hours after online publication and is updated daily on week days.
Initial download of the metrics may take a while.