Fig. 2
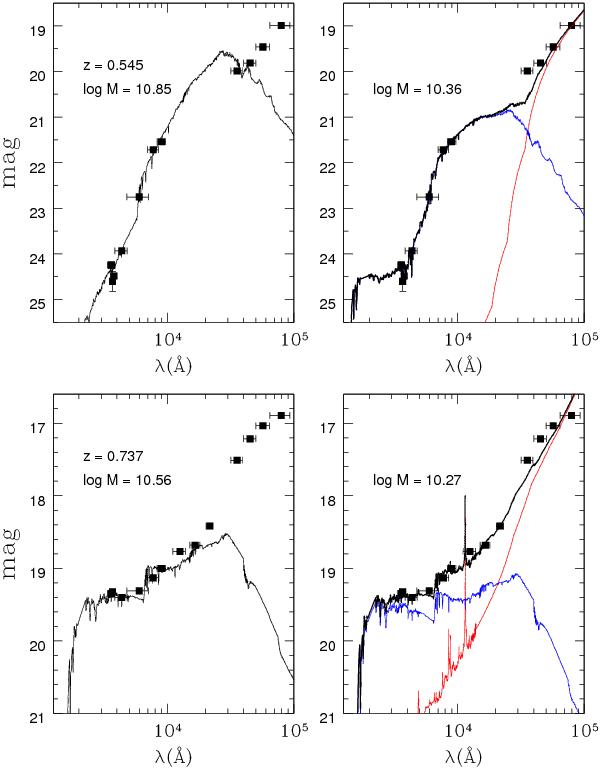
Observed and best-fit SEDs of a Sy1 galaxy (bottom) and a Compton Thin Sy2 (top), both lying in the GOODS-S field. Left panels show the fit with pure stellar templates, while the right ones show the decomposition between the stellar (blue) and nuclear (red) components. In the latter, the black lines represent the total emission (stars + AGN). The inferred stellar masses are reported in each panel.
Current usage metrics show cumulative count of Article Views (full-text article views including HTML views, PDF and ePub downloads, according to the available data) and Abstracts Views on Vision4Press platform.
Data correspond to usage on the plateform after 2015. The current usage metrics is available 48-96 hours after online publication and is updated daily on week days.
Initial download of the metrics may take a while.