Fig. 7
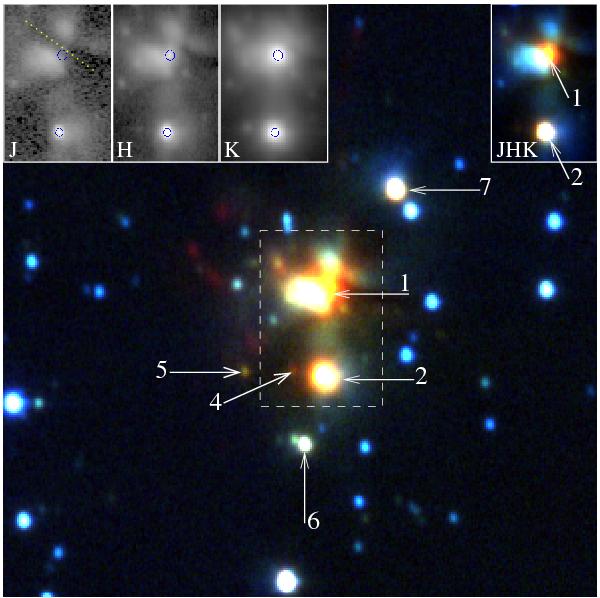
WFCAM JHH2 colour-composite image (J-blue, H-green, H2-red) in a 1′ × 1′ field containing “CI”. The top-left inset shows J, H and K images of the central 12′′ × 18′′ field (enclosed in the dashed box) at a higher contrast, with circles showing the locations of the two bright sources derived from the K-band image; a dotted yellow line is drawn on the J-band image along the extinciton lane to guide the eyes. The top-right inset shows a JHK colour composite of the same region (J-blue, H-green, K-red), revealing the bright point sources embedded in the nebulosity.
Current usage metrics show cumulative count of Article Views (full-text article views including HTML views, PDF and ePub downloads, according to the available data) and Abstracts Views on Vision4Press platform.
Data correspond to usage on the plateform after 2015. The current usage metrics is available 48-96 hours after online publication and is updated daily on week days.
Initial download of the metrics may take a while.