Fig. 5
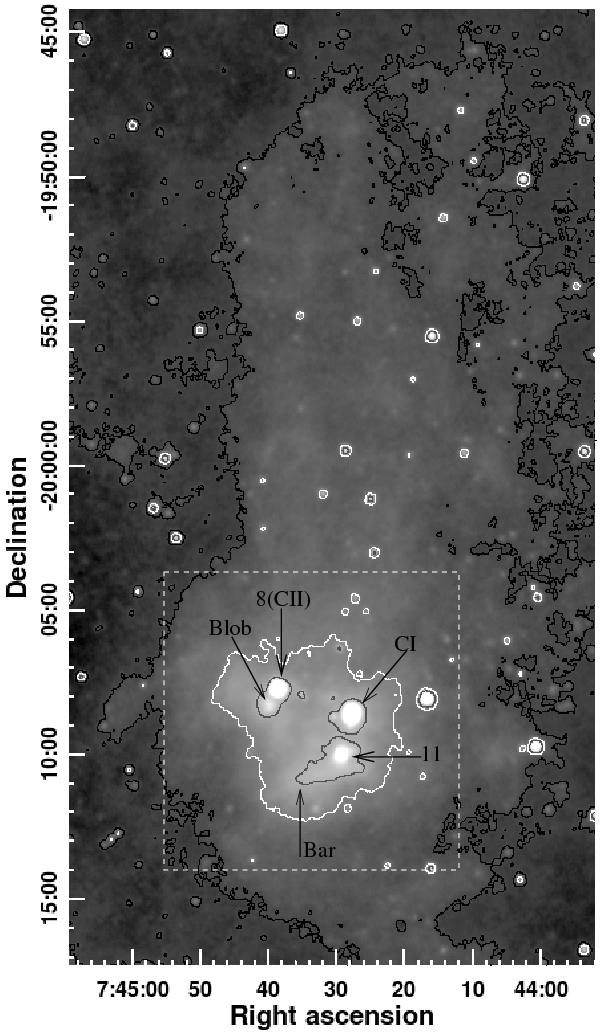
The WISE 12-μm image over a field of 18′ × 33′ encompassing the cloud in which IRAS 07422 is located. The contours in black, white and grey show the boundaries where the emission from the cloud falls to 15%, 40% and 85% respectively of the peak flux in the bar. Most of the star formation happening within this cloud is in the region within the white contours.
Current usage metrics show cumulative count of Article Views (full-text article views including HTML views, PDF and ePub downloads, according to the available data) and Abstracts Views on Vision4Press platform.
Data correspond to usage on the plateform after 2015. The current usage metrics is available 48-96 hours after online publication and is updated daily on week days.
Initial download of the metrics may take a while.