Fig. 3
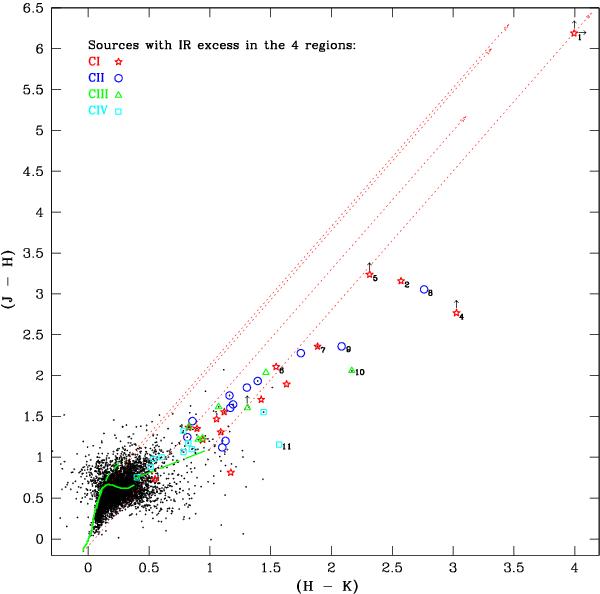
The JHK colour–colour diagram of the 13.5′ × 13.5′ field surrounding IRAS 07422. The curved lines show the loci of main sequence (continuous, green) and giant (short-dashed, green) stars from Tokunaga (2000). The long-dashed green line shows the loci of CTTS from Meyer et al. (1997). The dotted arrows (red) show the reddening vectors for AV ≤ 50 derived from the interstellar extinction law given by Rieke & Lebofsky (1985). The black dots show objects with photometric error less than 0.207 mag, which is our 1-σ error for a source of 19 mag in K. Sources which are fainter than 19 mag in K are not shown here. Objects with upper limit magnitudes in J are shows with an upward directed arrow; source #1 with H magnitude also is treated as an upper limit is shown with upward and rightward directed arrows.
Current usage metrics show cumulative count of Article Views (full-text article views including HTML views, PDF and ePub downloads, according to the available data) and Abstracts Views on Vision4Press platform.
Data correspond to usage on the plateform after 2015. The current usage metrics is available 48-96 hours after online publication and is updated daily on week days.
Initial download of the metrics may take a while.