Fig. 10
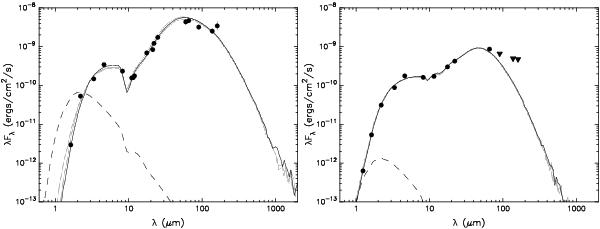
The left panel shows the SED of #1. The filled circles show the data from WFCAM at H and K, MSX at 8.28 and 21.34 μm, Michelle at 11.2 μm, WISE at 3.6–22 μm, IRAS at 12–60 μm, and AKARI at 18–140 μm wavelengths. The right panel shows the SED of #8. The filled circles show the data from WFCAM at J, H and K, MSX at 8.28 μm, Michelle at 11.2 μm, WISE 3.6–22 μm and AKARI at 18 and 65 μm; the downward directed triangles show the AKARI 90–160 μm-band data, which are treated as upper limits only. The continuous line shows the best fit model and the grey lines show subsequent good fits for ( ) per data point <3. The dashed line corresponds to the stellar photosphere for the central source of the best fitting model, as it would look in the absence of circumstellar dust (but including interstellar extinction).
Current usage metrics show cumulative count of Article Views (full-text article views including HTML views, PDF and ePub downloads, according to the available data) and Abstracts Views on Vision4Press platform.
Data correspond to usage on the plateform after 2015. The current usage metrics is available 48-96 hours after online publication and is updated daily on week days.
Initial download of the metrics may take a while.