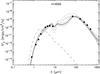
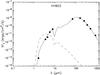
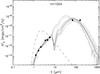
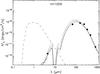
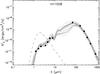
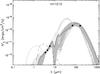
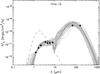
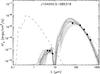
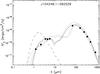
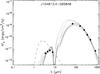
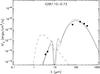
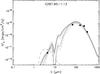
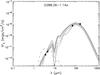
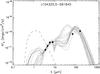
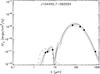
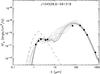
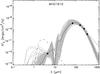
Fig. 7
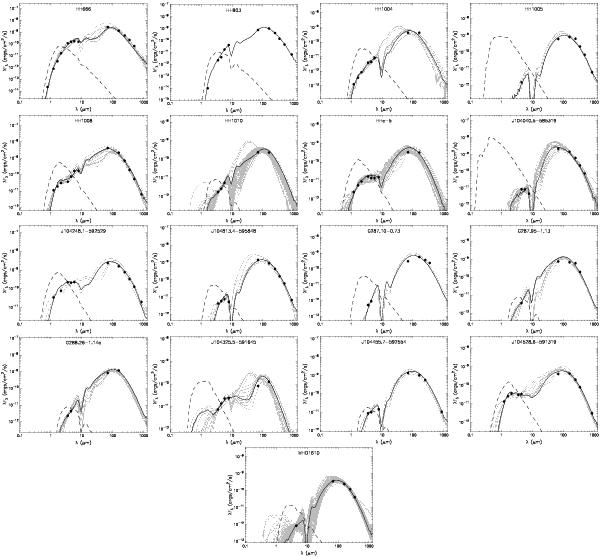
Spectral energy distributions of those 17 objects for which we could determine fluxes in at least four bands overall. Filled circles mark the input fluxes. The black line shows the best fit, and the grey lines show subsequent good fits. The dashed line represents the stellar photosphere corresponding to the central source of the best-fitting model, as it would appear in the absence of circumstellar dust (but including interstellar extinction).
Current usage metrics show cumulative count of Article Views (full-text article views including HTML views, PDF and ePub downloads, according to the available data) and Abstracts Views on Vision4Press platform.
Data correspond to usage on the plateform after 2015. The current usage metrics is available 48-96 hours after online publication and is updated daily on week days.
Initial download of the metrics may take a while.