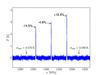
Fig. 8
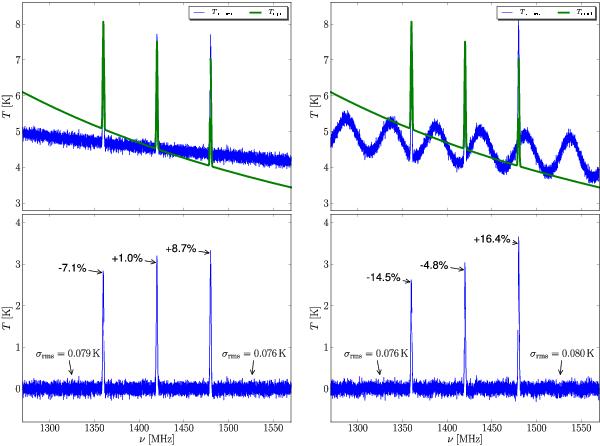
Applying the “classical” calibration scheme that is currently in use at the 100-m telescope (for online display purposes), using Eq. (27), we obtain the reduced spectra (upper row). The input spectra Tinput (green) are also shown for reference. Not only are the flux values of the Gaussians improperly reconstructed, which becomes visible after baseline subtraction (lower row), the inferred continuum fluxes of the source are also incorrect. The left panels show the results for the simpler case, while the right panels includes the standing wave contribution.
Current usage metrics show cumulative count of Article Views (full-text article views including HTML views, PDF and ePub downloads, according to the available data) and Abstracts Views on Vision4Press platform.
Data correspond to usage on the plateform after 2015. The current usage metrics is available 48-96 hours after online publication and is updated daily on week days.
Initial download of the metrics may take a while.