Fig. B.2
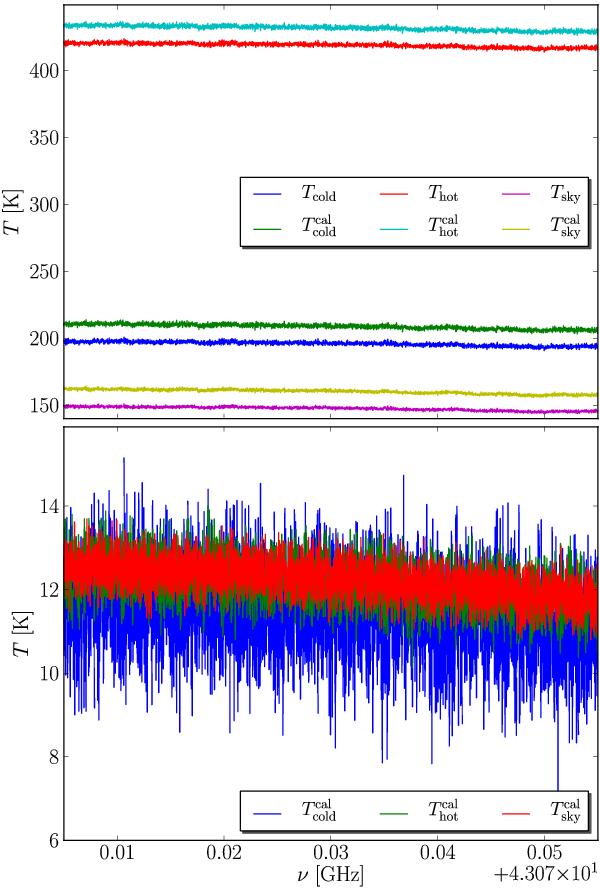
Upper panel: with the determined transfer function (Fig. B.1lower panel), one can calibrate the raw spectra (Fig. B.1upper panel). The individual spectra show a slight slope. Tsky is equivalent to the overall system temperature Tsys (which of course is a function of observational parameters as telescope pointing position, temperature, atmospheric conditions, etc). Lower panel: using the results from the upper panel, one can recover the Tcal spectrum. Note that the blue curve  is different from the two other measurements. (For a discussion of this issue, see text.)
Current usage metrics show cumulative count of Article Views (full-text article views including HTML views, PDF and ePub downloads, according to the available data) and Abstracts Views on Vision4Press platform.
Data correspond to usage on the plateform after 2015. The current usage metrics is available 48-96 hours after online publication and is updated daily on week days.
Initial download of the metrics may take a while.