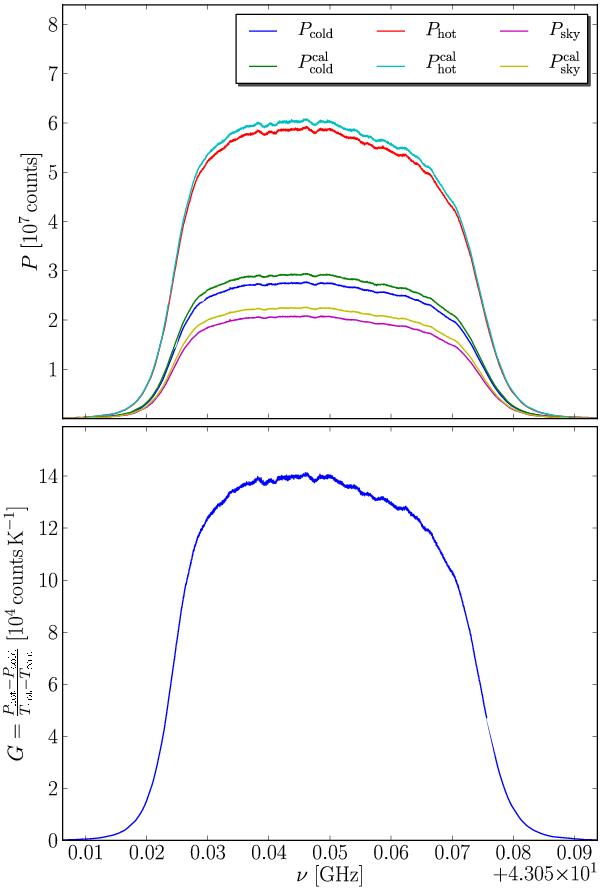
Fig. B.1

Upper panel: raw spectra measured during a hot-cold experiment with the 6.5-mm receiver in spectroscopy mode. Each spectrum is the average of a 10 min observation. The sky position was observed afterwards by pointing the telescope to the zenith. Lower panel: using the raw spectra measured for hot and cold load, one can infer the (calibrated) gain-curve, i.e. the transfer function. Residual noise is present but the overall shape and even several small features are clearly visible.
Current usage metrics show cumulative count of Article Views (full-text article views including HTML views, PDF and ePub downloads, according to the available data) and Abstracts Views on Vision4Press platform.
Data correspond to usage on the plateform after 2015. The current usage metrics is available 48-96 hours after online publication and is updated daily on week days.
Initial download of the metrics may take a while.


