Free Access
Fig. A.1
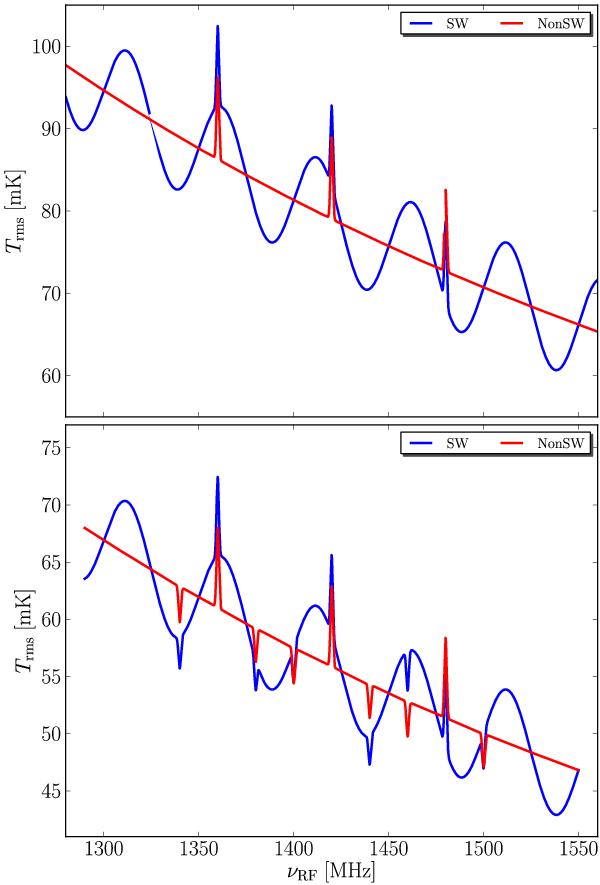
Theoretical noise levels for the example simulations. The upper panel shows the resulting rms for position switching, and the lower panel contains the frequency switching results, which are about a factor of  lower because of the longer effective integration time on-source.
This figure is made of several images, please see below:
Current usage metrics show cumulative count of Article Views (full-text article views including HTML views, PDF and ePub downloads, according to the available data) and Abstracts Views on Vision4Press platform.
Data correspond to usage on the plateform after 2015. The current usage metrics is available 48-96 hours after online publication and is updated daily on week days.
Initial download of the metrics may take a while.