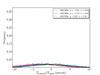
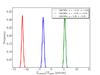
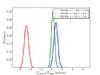
Fig. 26
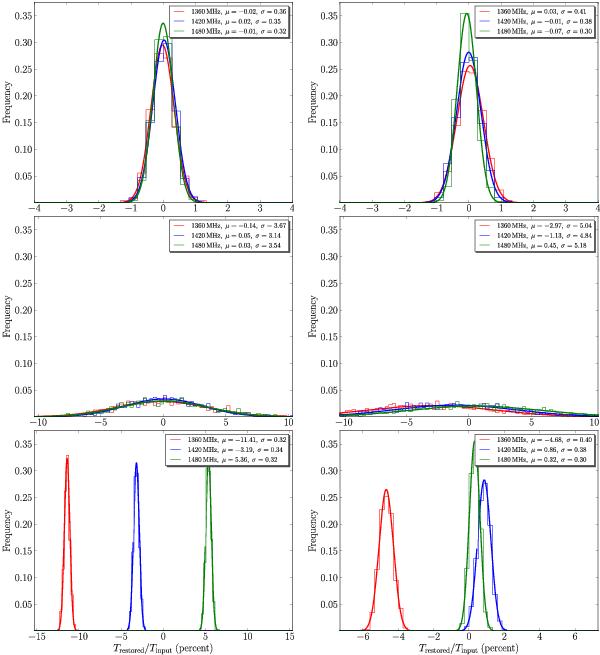
As in Fig. 25, the plots show the error distribution for a thousand simulations after applying frequency switching. For the first method, Sect. 4.3, the resulting histograms are somewhat smaller, which can be attributed to the slightly smaller residual baseline rms (~80 mK for frequency switching, ~120 mK for position switching) in our simulations. The situation is much worse when using the second calibration scheme, Sect. 4.4. The distributions are broader, even more so in the SW case, owing to the relatively small difference between f and fcal.
Current usage metrics show cumulative count of Article Views (full-text article views including HTML views, PDF and ePub downloads, according to the available data) and Abstracts Views on Vision4Press platform.
Data correspond to usage on the plateform after 2015. The current usage metrics is available 48-96 hours after online publication and is updated daily on week days.
Initial download of the metrics may take a while.