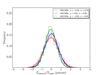
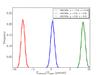
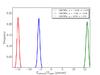
Fig. 25
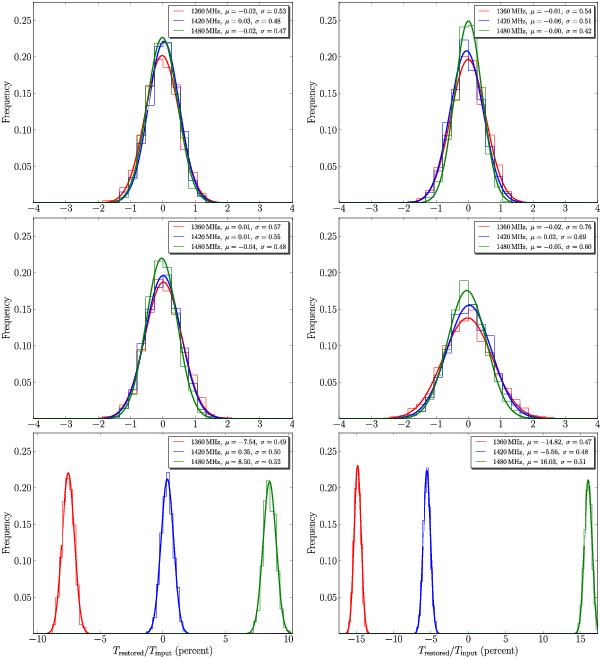
To estimate the robustness of the different methods, we repeated each simulation a thousand times. The resulting flux errors for the three Gaussian components were evaluated. The histograms show the error distribution for the two cases, left (right) panels without (with) SW. The upper row shows the results for the method described in Sect. 3.2 using only Off positions to estimate Tcal/Tsys. The middle panels were produced using the procedure from Sect. 3.3. The lower row contains the result for the classical method (Tsys = const. and Tcal = const.). The bin width has been kept constant for each histogram, such that the amplitudes can be directly compared. For each distribution of errors, we fitted a Gaussian distribution, the parameters (mean value μ and width σ) of which are stated in the plots.
Current usage metrics show cumulative count of Article Views (full-text article views including HTML views, PDF and ePub downloads, according to the available data) and Abstracts Views on Vision4Press platform.
Data correspond to usage on the plateform after 2015. The current usage metrics is available 48-96 hours after online publication and is updated daily on week days.
Initial download of the metrics may take a while.