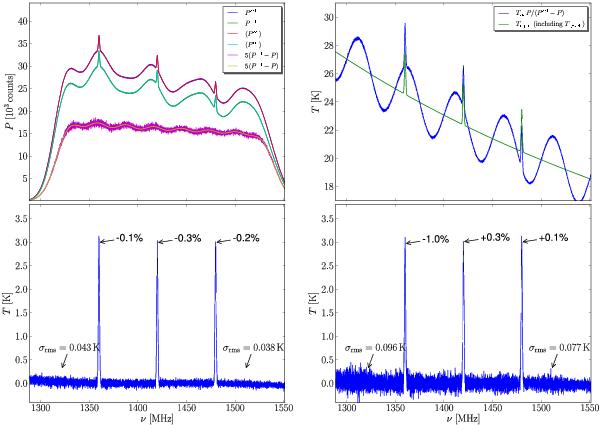
Fig. 24

Top left panel: input spectra (including SW) used for the direct method to determine the bandpass curve. It also contains Pcal − P for a single spectral dump and ⟨ Pcal − P ⟩ t as computed using the average of 1000 spectral dumps, both scaled by a factor of five for improved visualisation. The upper right panel shows the reduced data after applying Eq. (73). Note that the standing wave contribution is included in the result. The lower panels show the final spectra after baseline subtraction for Tcal/Tsys,off ≈ 15% (left panel) and Tcal/Tsys,off ≈ 2.5% (right panel).
Current usage metrics show cumulative count of Article Views (full-text article views including HTML views, PDF and ePub downloads, according to the available data) and Abstracts Views on Vision4Press platform.
Data correspond to usage on the plateform after 2015. The current usage metrics is available 48-96 hours after online publication and is updated daily on week days.
Initial download of the metrics may take a while.


