Fig. 23
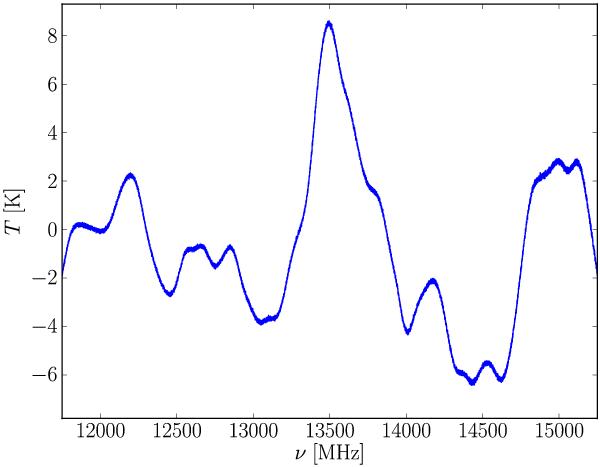
The resulting spectrum for a real-world example using frequency switching and the first calibration method (see Fig. 10 for temperature inputs). The only difference in comparison to the position switching example is the use of a single Gaussian with an amplitude of 10 K. Despite the larger line amplitude, the emission peak is not very pronounced in the result.
Current usage metrics show cumulative count of Article Views (full-text article views including HTML views, PDF and ePub downloads, according to the available data) and Abstracts Views on Vision4Press platform.
Data correspond to usage on the plateform after 2015. The current usage metrics is available 48-96 hours after online publication and is updated daily on week days.
Initial download of the metrics may take a while.