Fig. 20
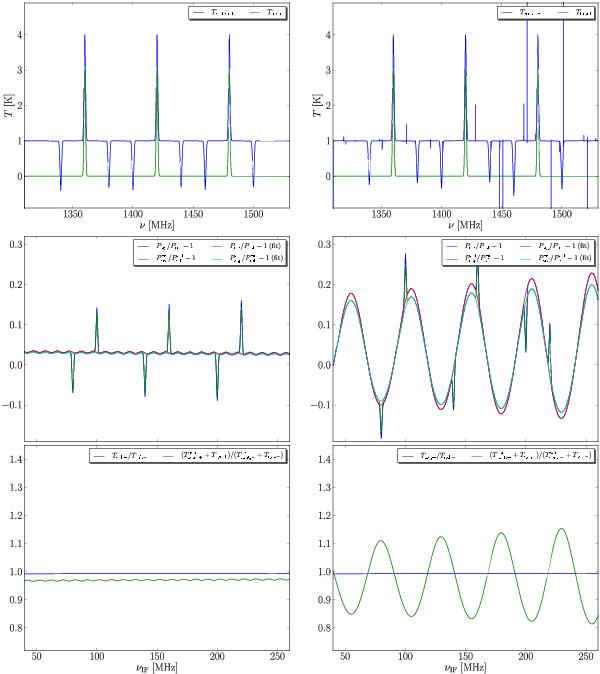
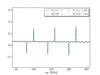
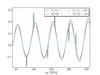
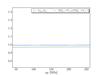
If the LO shift νLO is not a multiple of the standing wave frequency νsw, the quantity f − fcal can have several roots causing “resonances” in the final spectrum. The left panels have νsw = 10 MHz matching νLO = 10 MHz, while for the right panels we chose νsw = 50 MHz. The upper panels show the resulting spectra (simulations were performed without a noise contribution for a clearer visualisation). In the upper right panel, spikes do appear. The middle panels show the model fitting through  . While in the left middle panel fcal > f for all frequencies, in the right middle panel several crossings occur. The lower panels depict Eq. (56), which represents the condition for resonances to appear.

Current usage metrics show cumulative count of Article Views (full-text article views including HTML views, PDF and ePub downloads, according to the available data) and Abstracts Views on Vision4Press platform.
Data correspond to usage on the plateform after 2015. The current usage metrics is available 48-96 hours after online publication and is updated daily on week days.
Initial download of the metrics may take a while.