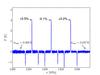
Fig. 17
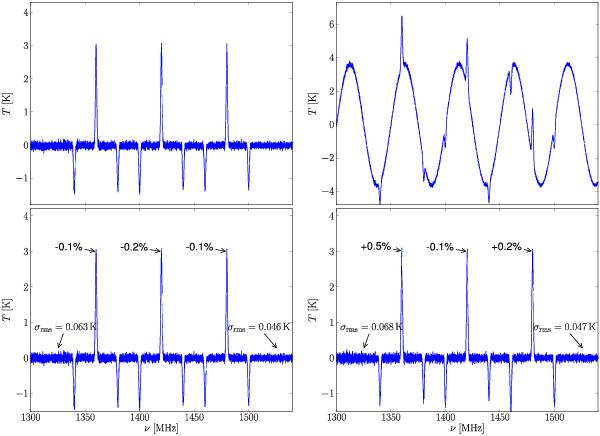
Using Eq. (36) and the fitting models from Fig. 16, one obtains the calibrated spectra. The upper left panel shows the result for the non-SW case, and the upper right panel for the SW case. A baseline was subtracted for both in the lower panels. In the SW case, the residual baseline is very complicated. The continuum of the source is not reconstructed.
Current usage metrics show cumulative count of Article Views (full-text article views including HTML views, PDF and ePub downloads, according to the available data) and Abstracts Views on Vision4Press platform.
Data correspond to usage on the plateform after 2015. The current usage metrics is available 48-96 hours after online publication and is updated daily on week days.
Initial download of the metrics may take a while.