Free Access
Fig. 16
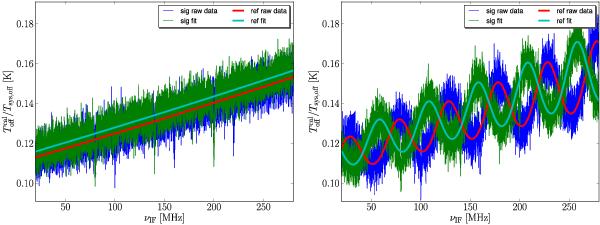
The spectrum of  for the simpler (left panel) and SW (right panel) cases and the inferred fitting models. Spectral windows are set around parts containing the spectral lines (not clearly visible in the plots due to noise), otherwise the models would have been influenced to some extent.
This figure is made of several images, please see below:
Current usage metrics show cumulative count of Article Views (full-text article views including HTML views, PDF and ePub downloads, according to the available data) and Abstracts Views on Vision4Press platform.
Data correspond to usage on the plateform after 2015. The current usage metrics is available 48-96 hours after online publication and is updated daily on week days.
Initial download of the metrics may take a while.