Fig. 15
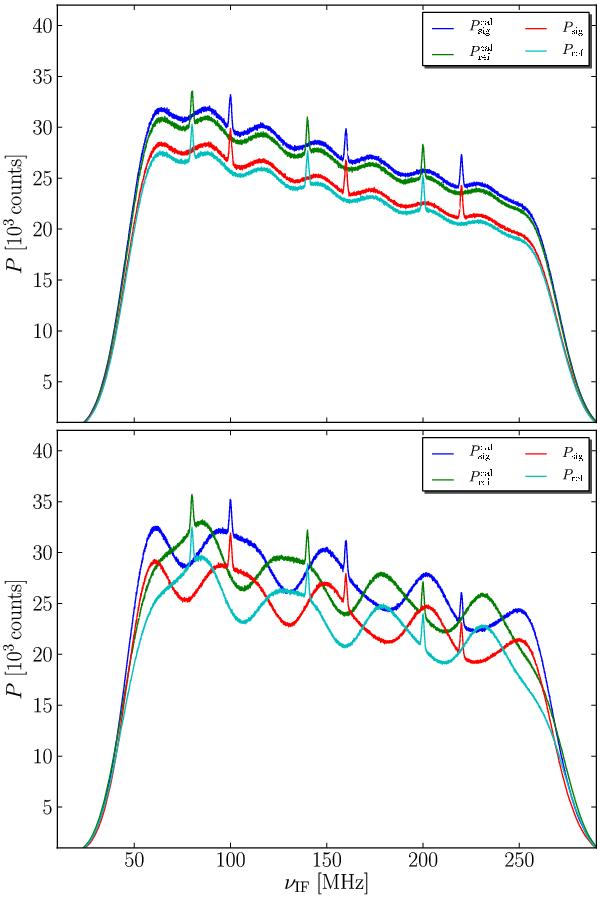
Shifting the input spectral densities with ± ΔνLO = ± 10 MHz and multiplying by the (IF) bandpass shape (see Fig. 2) returns the “measured” spectra Psig,ref. The upper panel shows the results for the simpler case, while the lower panel includes a standing wave contribution (νsw = 50 MHz). Note that for the method described in Sect. 4.4 we used a smaller standing wave frequency (νsw = νLO = 10 MHz) in contrast to the other examples in order to avoid resonances (see also Sect. 4.4.1).
Current usage metrics show cumulative count of Article Views (full-text article views including HTML views, PDF and ePub downloads, according to the available data) and Abstracts Views on Vision4Press platform.
Data correspond to usage on the plateform after 2015. The current usage metrics is available 48-96 hours after online publication and is updated daily on week days.
Initial download of the metrics may take a while.