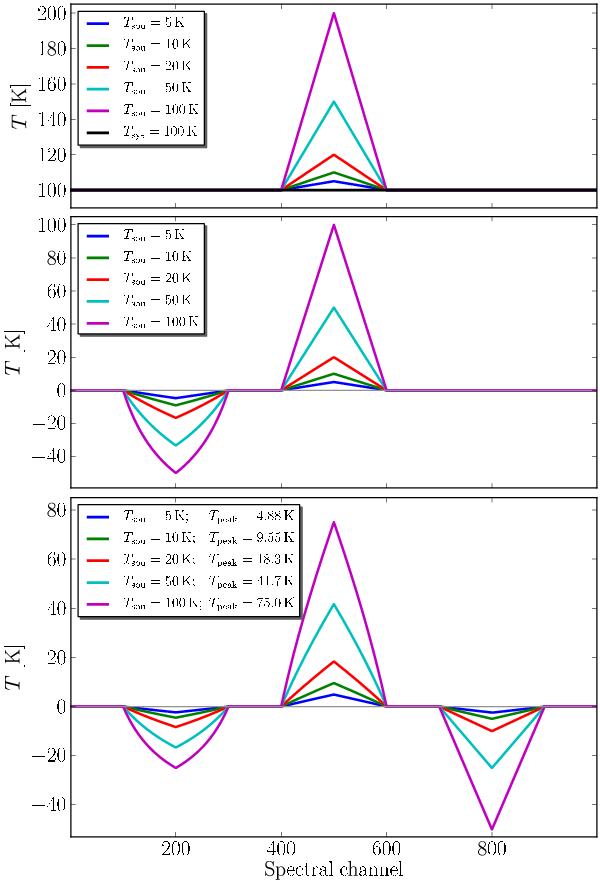
Fig. 14
Applying the frequency-switching base equation, Eq. (36), one would expect the spectral-line ghosts to have half the amplitude of the original line. However, in practice one is usually unable to determine  – required for Eqs. (34) and (35) – but only
  . As a consequence the inferred calibration is wrong at frequencies where the spectral-line ghosts appear. This does not only affect the amplitude of the ghosts, but even their shape gets distorted. To show the effect of this, we use a simple model in which different source intensities (Tsou = 5,10,20,50,100 K) were added to a hypothetical system temperature, Tsys = 100 K (top panel). The bandpass was assumed to be flat. For visualisation purposes, the spectral lines are triangular-shaped. Increasing the input source temperature with respect to Tsys decreases the line ratios of Tghost to Tsou after applying frequency shifting (middle panel). In addition the distortion becomes more and more pronounced. Finally, in the bottom panel the result of a simple shift-flip-sign-averaging (so-called folding; see also Eq. (37)) is presented. The legend contains the reconstructed peak temperatures, which are systematically deficient for larger ratios of Tsou/Tsys. This folding algorithm should clearly be avoided for cases where Tsou3Tsys.
Current usage metrics show cumulative count of Article Views (full-text article views including HTML views, PDF and ePub downloads, according to the available data) and Abstracts Views on Vision4Press platform.
Data correspond to usage on the plateform after 2015. The current usage metrics is available 48-96 hours after online publication and is updated daily on week days.
Initial download of the metrics may take a while.