Fig. 1
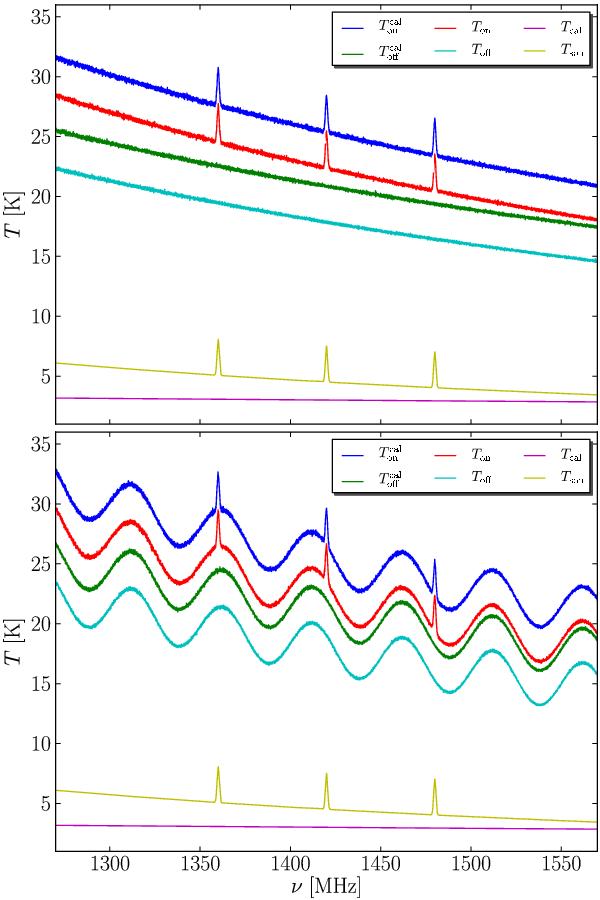
To test the influence of the different calibration schemes on the reconstructed flux values, synthetic spectra were produced. The upper panel shows the input power spectral densities. The antenna temperature on-source (Tsou) is a superposition of three Gaussians with an amplitude of 3 K on top of a continuum spectrum with a spectral index of − 0.7, i.e. Tsou ~ ν-2.7. For the system temperature, Tsys,off ~ ν-2.1 is used for convenience. We also simulate a slight frequency-dependence of the calibration diode using the power law Tcal ~ ν-0.5. Gaussian noise was added to the four measurement phases according to their total temperature values (see text). Note that each synthetic spectrum contains a different noise realisation. In addition, a more complicated case is included with a standing wave contribution, which is parametrised as a monochromatic sine wave component (lower panel).
Current usage metrics show cumulative count of Article Views (full-text article views including HTML views, PDF and ePub downloads, according to the available data) and Abstracts Views on Vision4Press platform.
Data correspond to usage on the plateform after 2015. The current usage metrics is available 48-96 hours after online publication and is updated daily on week days.
Initial download of the metrics may take a while.