Fig. 5
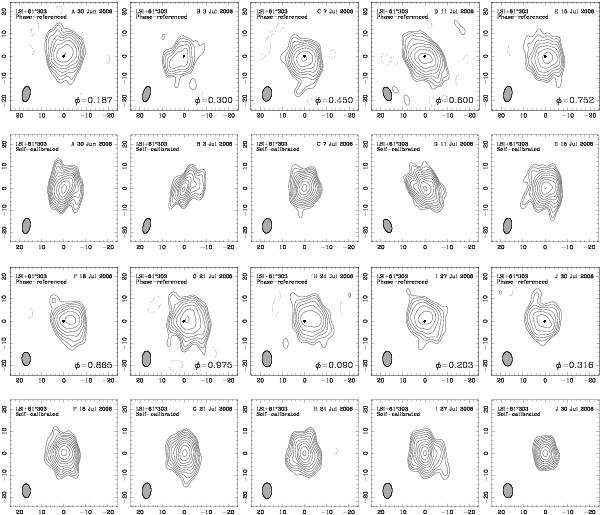
Top: images of VLBA runs A–J at 13 cm (2.3 GHz) of LS I +61°303. For each run, two maps are presented, the phase referenced map and the self-calibrated map. Both maps are produced with uniform weight and the beam is 3.5–4.1 × 6.9–7.2. Contour levels for all maps are − 4, 4, 5.66, 8, 11.3, 16, 22.6, 32, 45.2, 64, 90.5, 128, 181σ (with 1σ = 0.4 − 0.6 mJy/beam for phase-referenced maps, and 1σ = 0.3 mJy/beam for self-calibrated maps).
Current usage metrics show cumulative count of Article Views (full-text article views including HTML views, PDF and ePub downloads, according to the available data) and Abstracts Views on Vision4Press platform.
Data correspond to usage on the plateform after 2015. The current usage metrics is available 48-96 hours after online publication and is updated daily on week days.
Initial download of the metrics may take a while.