Fig. 9
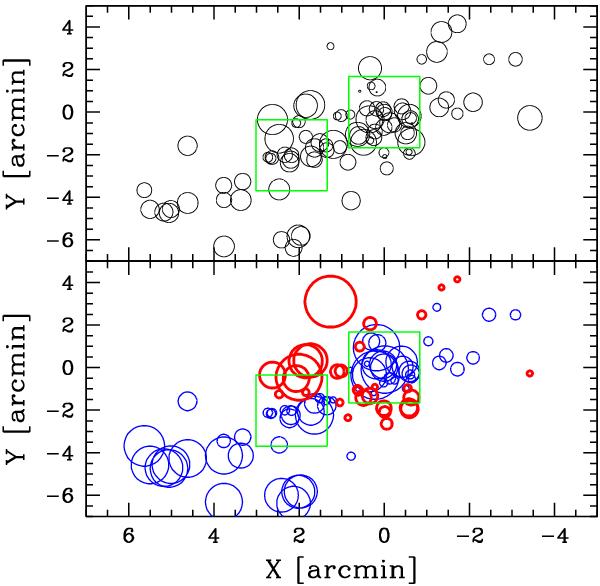
Spatial distribution of the 92 cluster members, each marked by a circle. The BCGN(NW) is taken as the cluster center. Upper panel: the cluster velocity field: the larger the circle, the larger the galaxy velocity. Lower panel: the result of the (modified) DS-test: the larger the circle, the larger the deviation δs,i of the local velocity dispersion from the global velocity dispersion. Thin/blue and thick/red circles show where the local velocity dispersion is lower or higher than the global value. The two large green squares indicate the positions of the two BCGs.
Current usage metrics show cumulative count of Article Views (full-text article views including HTML views, PDF and ePub downloads, according to the available data) and Abstracts Views on Vision4Press platform.
Data correspond to usage on the plateform after 2015. The current usage metrics is available 48-96 hours after online publication and is updated daily on week days.
Initial download of the metrics may take a while.