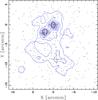
Fig. 8
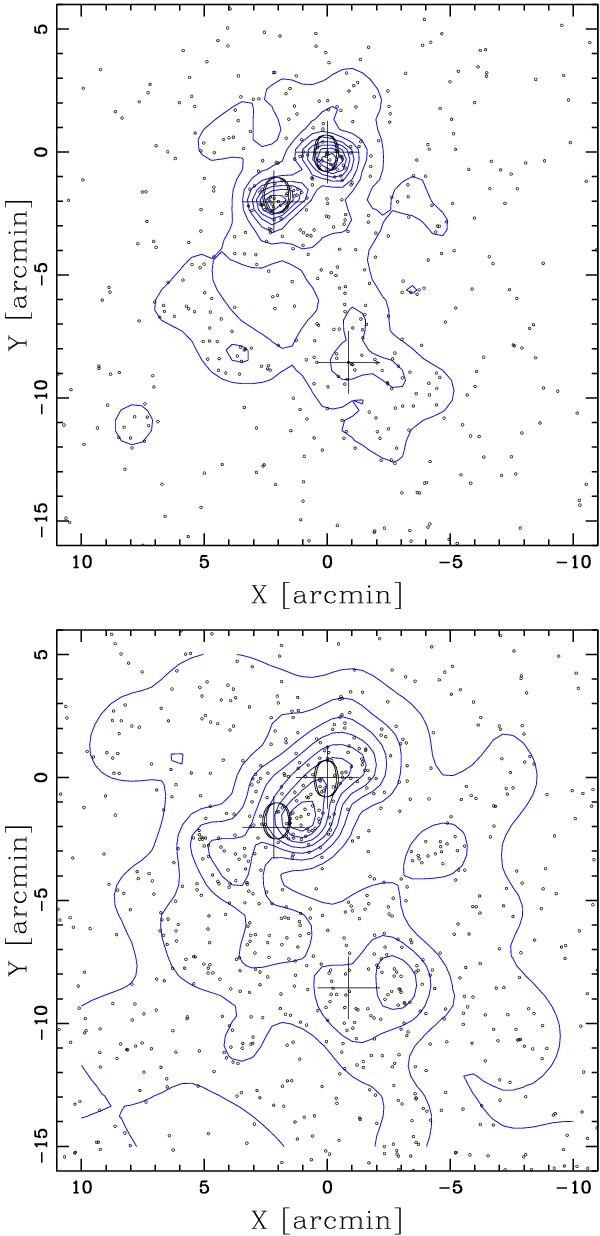
Spatial distribution on the sky and relative isodensity contour map of CFHT photometric cluster members with rMega ≤ 21 (upper panel) and 21 < rMega ≤ 23 (lower panel), obtained with the 2D-DEDICA method. The BCGN(NW) is taken as the cluster center. Northern crosses indicate the location of the BCGN(NW) and BCGN(SE) of A1758N. The southern cross indicates the BCGS of A1758S. For A1758N, the two large “O” labels are centered on the two main peaks of the mass distribution (Okabe et al. 2008).
Current usage metrics show cumulative count of Article Views (full-text article views including HTML views, PDF and ePub downloads, according to the available data) and Abstracts Views on Vision4Press platform.
Data correspond to usage on the plateform after 2015. The current usage metrics is available 48-96 hours after online publication and is updated daily on week days.
Initial download of the metrics may take a while.