Fig. 15
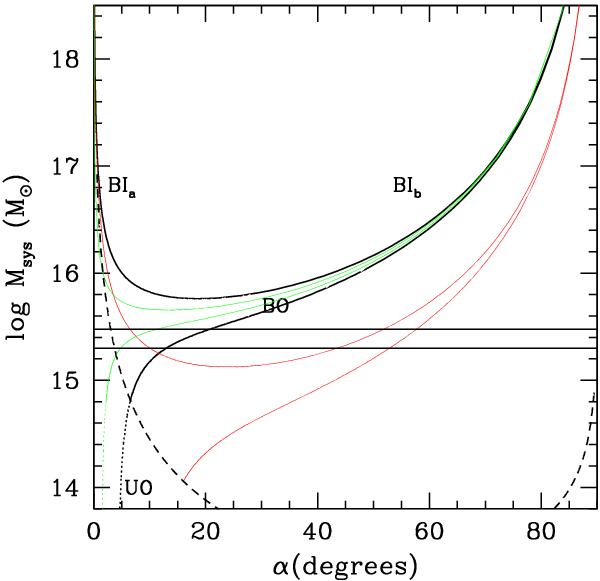
System mass vs. projection angle for bound and unbound solutions (thick solid and thick dashed curves, respectively) of the two-body model applied to the A1758N(NW) A1758N(SE) subclusters. Thick/black lines refer to t = 0.2 Gyr and Vrf,LOS = 300 km s-1. Labels BIa and BIb indicate the bound and incoming, i.e., collapsing solutions (solid curve). Labels BO and UO indicate the bound outgoing, i.e., expanding solutions and unbound outgoing solutions (solid curve going on in the dotted curve, respectively). The horizontal lines give the range of observational values of the mass system. The dashed curve separates bound and unbound regions according to the Newtonian criterion (above and below the thin dashed curve, respectively). The red/faint lines refer to t = 0.5 Gyr and Vrf,LOS = 300 km s-1. The green/faint lines refer to t = 0.2 Gyr and Vrf,LOS = 100 km s-1.
Current usage metrics show cumulative count of Article Views (full-text article views including HTML views, PDF and ePub downloads, according to the available data) and Abstracts Views on Vision4Press platform.
Data correspond to usage on the plateform after 2015. The current usage metrics is available 48-96 hours after online publication and is updated daily on week days.
Initial download of the metrics may take a while.