Fig. 14
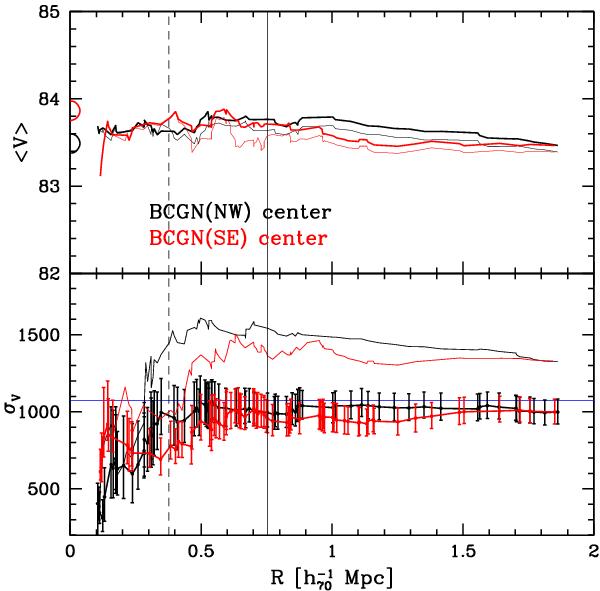
Upper and lower panels: integral profiles of mean velocity and LOS velocity dispersion, respectively. Black and red lines consider as centers BCGN(NW) and BCG(SE), respectively. In both panels the vertical solid lines indicate the distance of the BCG of the close subcluster and the dashed lines indicate the half distance. Thin and thick lines give the results for all galaxies and the main system HT11. In the upper panel, the two semi-circles give the velocity of the two BCGs. In the lower panel, the horizontal line represents the X-ray temperature as in Fig. 5.
Current usage metrics show cumulative count of Article Views (full-text article views including HTML views, PDF and ePub downloads, according to the available data) and Abstracts Views on Vision4Press platform.
Data correspond to usage on the plateform after 2015. The current usage metrics is available 48-96 hours after online publication and is updated daily on week days.
Initial download of the metrics may take a while.