Fig. 13
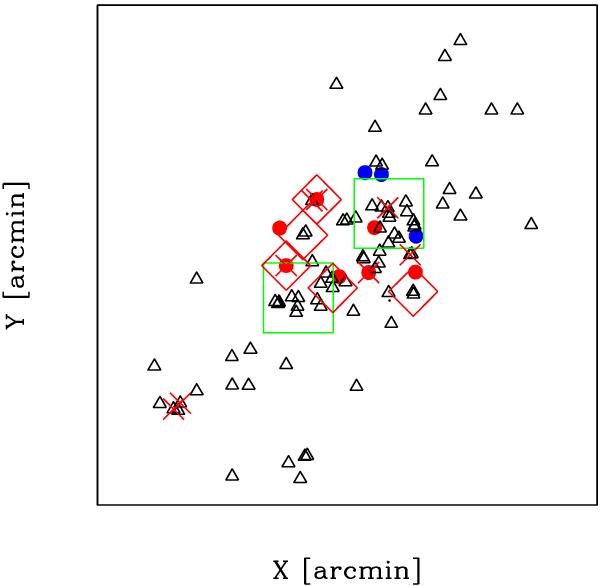
Spatial distribution on the sky of the cluster galaxies showing the subsystems recovered by the Htree analysis. Solid blue and red circles indicate the galaxies of HT2 and HT12, respectively. Triangles indicate the galaxies of the main system (HT1). The BCGN(NW) is taken as the cluster center. Very large/green squares indicate the positions of BCGN(NW) and BCGN(SE). Large/red crosses indicate ELGs. Large red diamonds indicate dusty star-forming galaxies in the sample of Haines et al. (2009).
Current usage metrics show cumulative count of Article Views (full-text article views including HTML views, PDF and ePub downloads, according to the available data) and Abstracts Views on Vision4Press platform.
Data correspond to usage on the plateform after 2015. The current usage metrics is available 48-96 hours after online publication and is updated daily on week days.
Initial download of the metrics may take a while.