Fig. 1
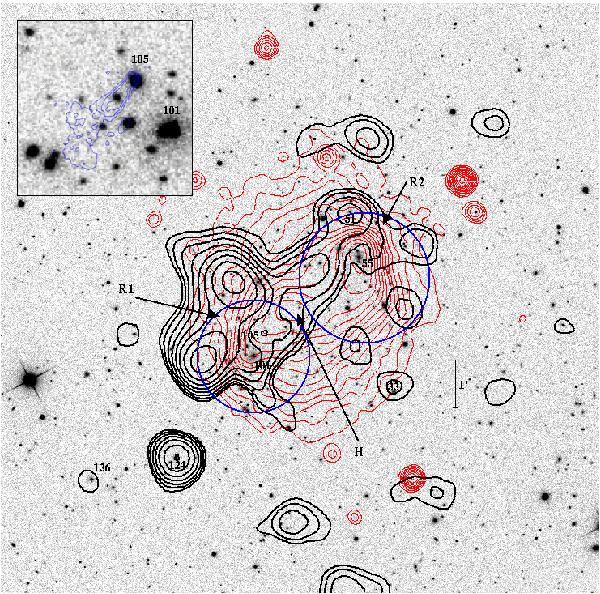
Multiwavelength picture of the cluster A1758N (north at the top and east to the left). Optical density peaks detected from our analysis of the galaxy distribution (big blue circles; see Sect. 3.4) are superimposed on the SDSS r′-band image of the cluster region. Labels indicate the IDs of galaxies cited in the text. Thin red contour levels show the ICM distribution we derived from the X-ray Chandra archival image ID 2213 (photons in the energy range 0.3–7 keV; see David & Kempner 2004, for an extensive analysis of these X-ray data). From Giovannini et al. (2009) we also reproduce the radio contour levels of their VLA radio image at 1.4 GHz (thick black contours, HPBW = 45′′ × 45′′) and highlight with arrows the positions of the radio halo (H, in the center) and the two peripheral radio relics (R1 and R2). The insert on the top left is a zoom on the region of the NAT radio galaxy 1330+507 (ID 105), with the radio contours taken from VLA high-resolution radio images presented by O’Dea & Owen (1985).
Current usage metrics show cumulative count of Article Views (full-text article views including HTML views, PDF and ePub downloads, according to the available data) and Abstracts Views on Vision4Press platform.
Data correspond to usage on the plateform after 2015. The current usage metrics is available 48-96 hours after online publication and is updated daily on week days.
Initial download of the metrics may take a while.