Fig. 33
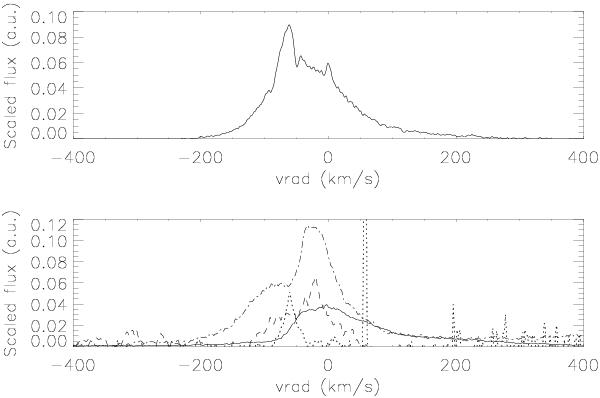
An example of the separation of the various contributors to the observed line profiles in the 2011 Aug. 21 NOT spectrum. Top: [O I] 6300 Å. Bottom: [O III] 5007 Å (solid), Mg I 4571 Å (dot), [S II] 6716 Å (dash), [N II] 6548 Å (dot-dash). The Mira continuum has been removed in each but the scaling is for display (arbitrary flux units). The spike at +60 km s-1 is a cosmic ray hit near Mg I. See text for description. No velocity shifts have been applied.
Current usage metrics show cumulative count of Article Views (full-text article views including HTML views, PDF and ePub downloads, according to the available data) and Abstracts Views on Vision4Press platform.
Data correspond to usage on the plateform after 2015. The current usage metrics is available 48-96 hours after online publication and is updated daily on week days.
Initial download of the metrics may take a while.