Fig. 5
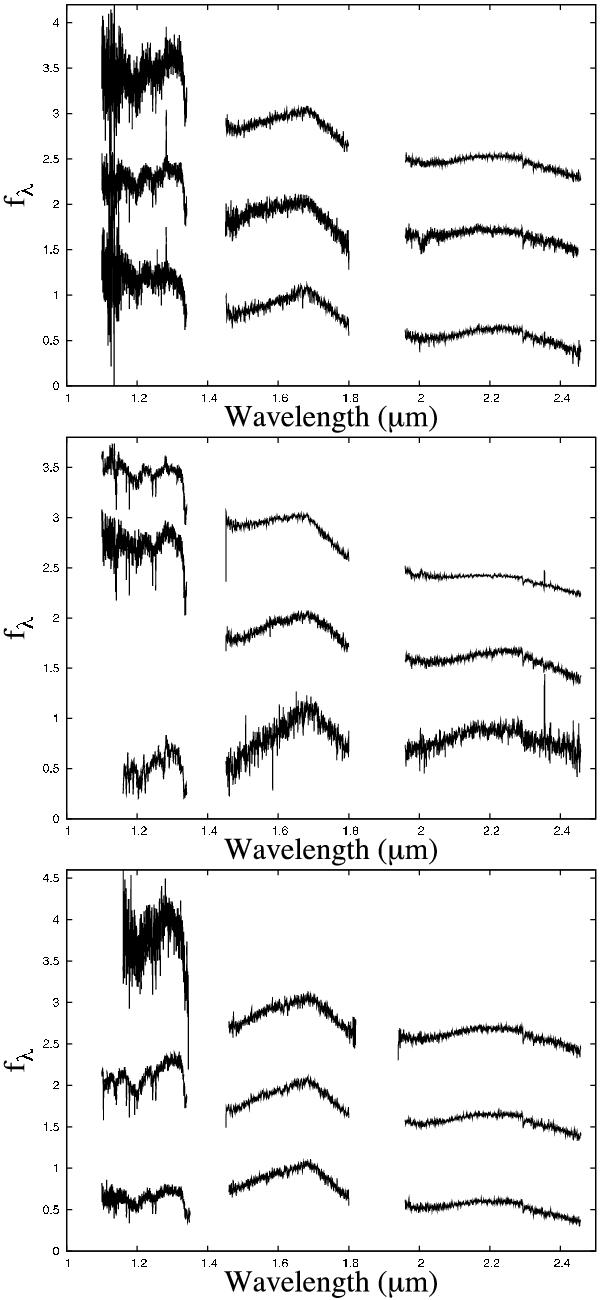
SINFONI J, H, K spectra of the sample, separated into three age groups: (top panel, top to bottom) the 1–3 Myr objects DH Tau B, GQ Lup B, and CT Cha B; (middle panel. top to bottom) the 8 Myr objects 2M1207A, TWA 5B and 2M1207B; (bottom panel, top to bottom) the 30–50 Myr objects GSC 08047B, 2M0141, and AB Pic B. For each age group, the spectra are ordered from hottest (top) to coolest (bottom), and an offset has been added to the flux for ease of comparison. The spectra of the youngest subset have been dereddened based on the extinction measured for the primaries.
Current usage metrics show cumulative count of Article Views (full-text article views including HTML views, PDF and ePub downloads, according to the available data) and Abstracts Views on Vision4Press platform.
Data correspond to usage on the plateform after 2015. The current usage metrics is available 48-96 hours after online publication and is updated daily on week days.
Initial download of the metrics may take a while.