Fig. 10
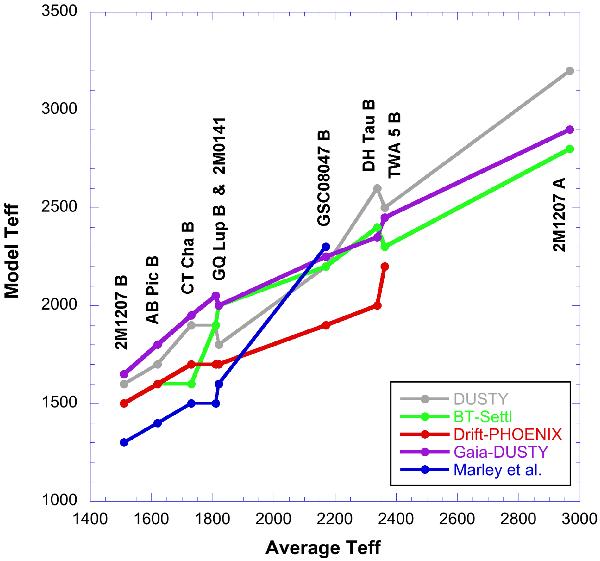
The best-fit effective temperature of each object inferred from the restricted log (g) fits to each model (DUSTY – grey, BT-Settl – green, Drift-PHOENIX – red, Gaia-Dusty – purple, Marley et al. – blue) plotted against the average of all the plotted model fits, excluding values at the edge of each grid. Considering all models, each object has a range of ± 150–300 K, and the dispersion in temperature does not show a clear trend as a function of average effective temperature.
Current usage metrics show cumulative count of Article Views (full-text article views including HTML views, PDF and ePub downloads, according to the available data) and Abstracts Views on Vision4Press platform.
Data correspond to usage on the plateform after 2015. The current usage metrics is available 48-96 hours after online publication and is updated daily on week days.
Initial download of the metrics may take a while.