Fig. 8
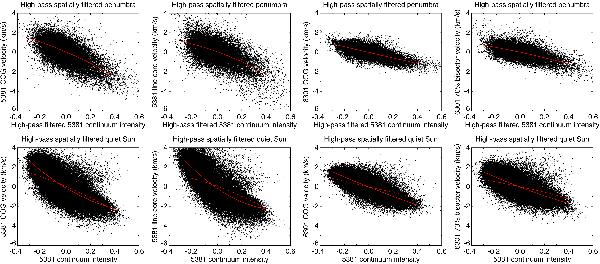
Correlation between the high-pass filtered 538 nm continuum intensity and the high-pass filtered LOS velocity, measured with different methods in the 5380 and 6301 lines. The top row shows plots for the “interior penumbra”, the bottom row corresponding plots for quiet Sun. For easier comparison, the red curves show in the upper panels are shown as dashed curves in the lower panels. Note that the velocities plotted are referenced to local averages by spatial filtering (unsharp masking).
Current usage metrics show cumulative count of Article Views (full-text article views including HTML views, PDF and ePub downloads, according to the available data) and Abstracts Views on Vision4Press platform.
Data correspond to usage on the plateform after 2015. The current usage metrics is available 48-96 hours after online publication and is updated daily on week days.
Initial download of the metrics may take a while.