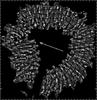
Fig. 5
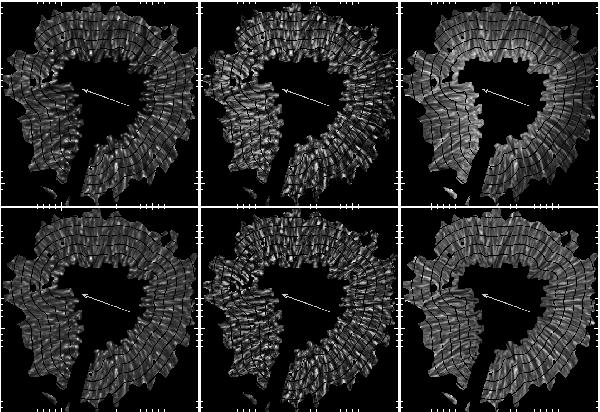
Examples of measured quantities with superimposed contours outlining the six radial zones in the penumbra, numbered 1 (adjacent to the umbra) to 6 (the outermost penumbra). Radial zones 2–4 constitute what is referred to as the “interior penumbra”. In the top row are shown (left to right) the 538 nm continuum intensity, the COG velocity in the same line and the LOS component of the magnetic field, obtained with the COG method. In the lower row are shown the same quantities but high-pass spatially filtered to remove large-scale azimuthal and radial variations. Tick marks are at 1′′ intervals. The arrow points in the direction of Sun center.


Current usage metrics show cumulative count of Article Views (full-text article views including HTML views, PDF and ePub downloads, according to the available data) and Abstracts Views on Vision4Press platform.
Data correspond to usage on the plateform after 2015. The current usage metrics is available 48-96 hours after online publication and is updated daily on week days.
Initial download of the metrics may take a while.