Fig. 3
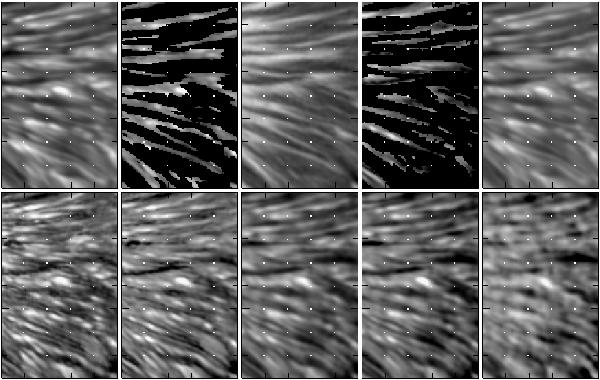
The figure shows a 5′′ × 8′′ sub-field from the right-hand side (mostly limb-side) penumbra, outlined in Fig. 1. The top row shows the 538 nm continuum, the 5380 COG velocity within the spine mask, the LOS magnetic field, the 5380 COG velocity within the inter-spine mask, and the 6301 continuum intensity. The bottom row shows the 5380 COG velocity, the 5380 line core velocity, the 6301 COG velocity, 6301 70% bisector velocity and the 6301 line core velocity. The velocity maps have been scaled individually to enhance fine structure. Maps shown represent original quantities and have not been processed with unsharp masking. Tick marks and small white dots are at 1′′ intervals.
Current usage metrics show cumulative count of Article Views (full-text article views including HTML views, PDF and ePub downloads, according to the available data) and Abstracts Views on Vision4Press platform.
Data correspond to usage on the plateform after 2015. The current usage metrics is available 48-96 hours after online publication and is updated daily on week days.
Initial download of the metrics may take a while.