Fig. 14
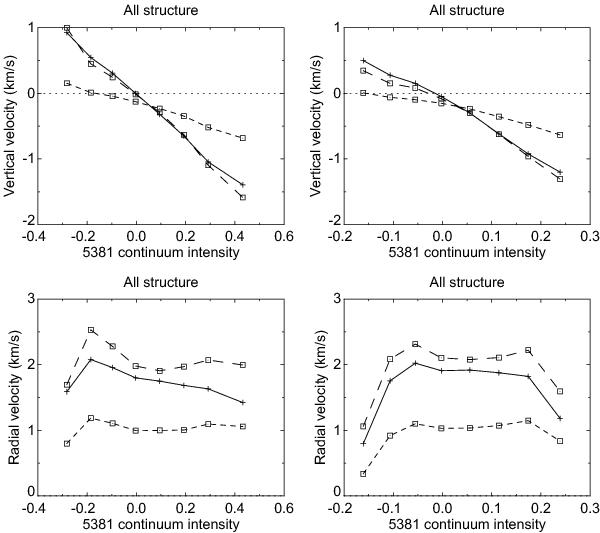
Comparison of vertical (top) and radial (bottom) velocities measured in the 6301 line, with (left column) and without (right column) straylight compensation. All structure in the interior penumbra (spines, inter-spines and the intermediate population) were included in the fits. Lines drawn full correspond to COG measurements, short dashes to the line core, and long dashes to the 70% bisector LOS velocities.
Current usage metrics show cumulative count of Article Views (full-text article views including HTML views, PDF and ePub downloads, according to the available data) and Abstracts Views on Vision4Press platform.
Data correspond to usage on the plateform after 2015. The current usage metrics is available 48-96 hours after online publication and is updated daily on week days.
Initial download of the metrics may take a while.