Fig. 10
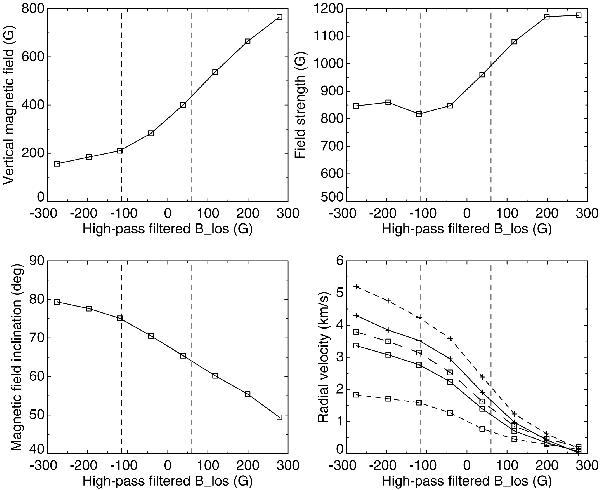
Variation of “interior penumbra” (radial zones 2–4) magnetic field and radial flow speed with the strength of the high-pass filtered LOS magnetic field, obtained from azimuthal fits. The top two plots show the variation of the vertical and horizontal components of the magnetic field, the lower-left the variation in magnetic field inclination. The lower-right plot shows the (remarkable!) variation of the radial flow velocity, measured with five different methods from the 5380 and 6301 lines. Plus symbols correspond to measurements in the 5380 line, squares to the 6301 line, lines drawn full to COG measurements, short dashes to line core, and long dashes to 70% bisector (6301 line only) LOS velocities. The vertical dashed lines correspond to the upper and lower thresholds respectively, for “inter-spines” and “spines”.
Current usage metrics show cumulative count of Article Views (full-text article views including HTML views, PDF and ePub downloads, according to the available data) and Abstracts Views on Vision4Press platform.
Data correspond to usage on the plateform after 2015. The current usage metrics is available 48-96 hours after online publication and is updated daily on week days.
Initial download of the metrics may take a while.