Fig. 1
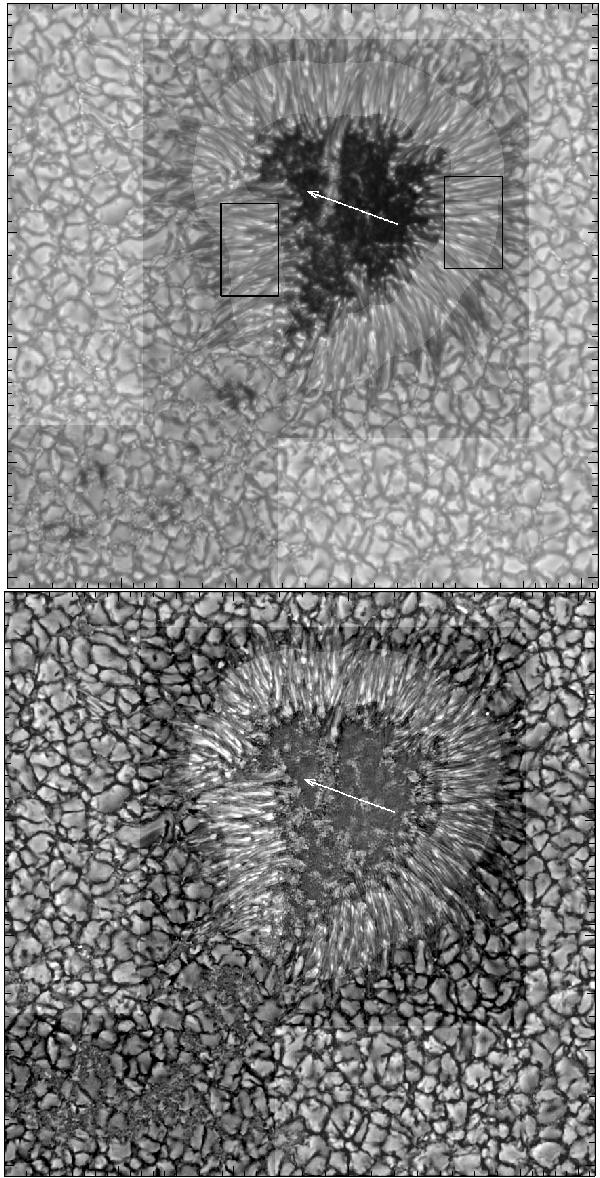
Overview of the entire FOV observed. The highlighted contiguous area close to the boundary of the FOV corresponds to the area used as quiet Sun reference, the highlighted area in the penumbra corresponds to what is referred to as the “interior penumbra”. The top panel corresponds to the 538 nm continuum, the right bottom to the COG velocity measured in the same line. Tick marks are at 1′′ intervals. The arrow points in the direction of Sun center. The dark rectangles outline sub-fields shown in Figs. 3 and 4.
Current usage metrics show cumulative count of Article Views (full-text article views including HTML views, PDF and ePub downloads, according to the available data) and Abstracts Views on Vision4Press platform.
Data correspond to usage on the plateform after 2015. The current usage metrics is available 48-96 hours after online publication and is updated daily on week days.
Initial download of the metrics may take a while.