Free Access
Fig. 2
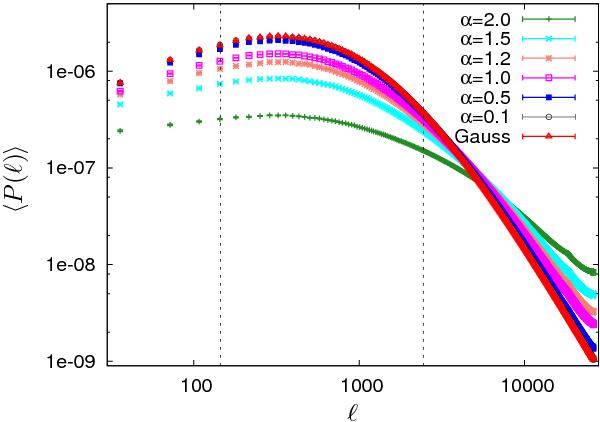
The mean power spectrum, averaged over 1000 realisations, of the Gaussian random field and the mean log-normal power spectrum for different degrees of non-Gaussianity α. The error bars are the standard deviation of the 1000 power spectra divided by  .
.
Current usage metrics show cumulative count of Article Views (full-text article views including HTML views, PDF and ePub downloads, according to the available data) and Abstracts Views on Vision4Press platform.
Data correspond to usage on the plateform after 2015. The current usage metrics is available 48-96 hours after online publication and is updated daily on week days.
Initial download of the metrics may take a while.