Fig. 4
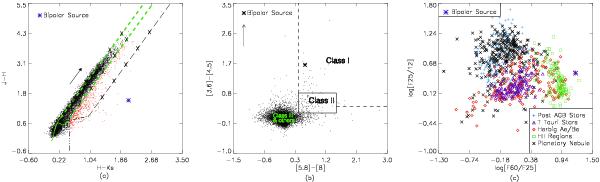
Near- to far-infrared color–color diagrams. a) (J − H) vs. (H − Ks) diagram. Green solid lines are the loci of the main-sequence dwarfs and giant stars (Bessell & Brett 1988). The arrow shows a reddening vector of AV = 5 mag (Rieke & Lebofsky 1985). The dot-dashed line indicates the locus of dereddened T Tauri stars (Meyer et al. 1997). The dashed lines, which are drawn parallel to the reddening vector, define the reddening band for normal field stars and T Tauri stars. Crosses are overplotted with an interval corresponding to AV = 5 mag. b) [3.6] − [4.5] vs. [5.8] − [8] diagram. The classification scheme is based Megeath et al. (2004) and Allen et al. (2004, 2007). The arrow indicates an extinction of AKs = 5 mag according to Indebetouw et al. (2005). c) log[F60/F25] vs. log[F25/F12] diagram. The sample of Hii regions, T Tauri stars, Herbig Ae/Be stars, post AGB stars, and planetary nebulae are adopted from Palla et al. (1991), Zhang et al. (2006a), Zhang et al. (2006b), Suárez et al. (2006), and Tajitsu & Tamura (1998), respectively. The protostar is presented as an asterisk in all three panels.
Current usage metrics show cumulative count of Article Views (full-text article views including HTML views, PDF and ePub downloads, according to the available data) and Abstracts Views on Vision4Press platform.
Data correspond to usage on the plateform after 2015. The current usage metrics is available 48-96 hours after online publication and is updated daily on week days.
Initial download of the metrics may take a while.