Fig. 1
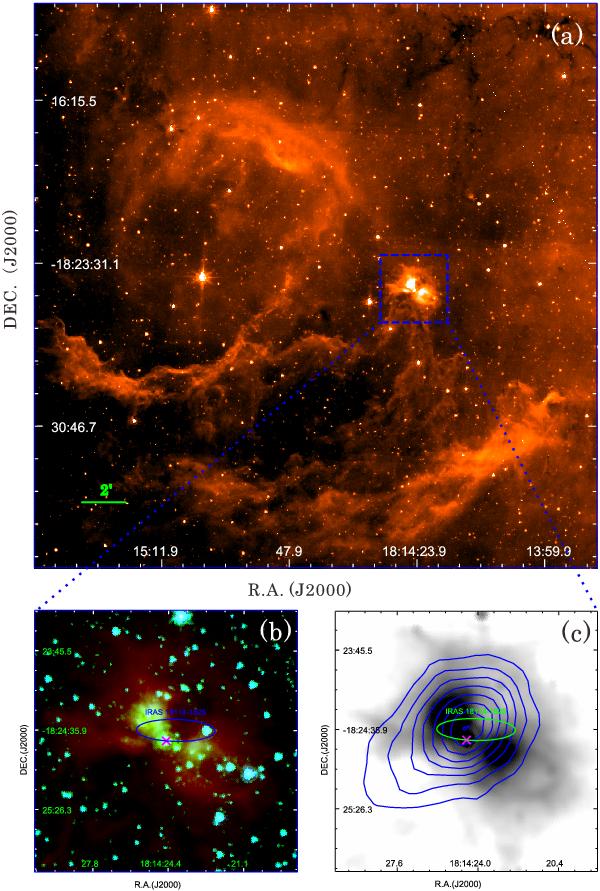
a) Spitzer/IRAC 8 μm mosaic of the bubble N6 in Deharveng et al. (2010). The blue dashed box indicates the the outflow structure. b) The composite color image of the IRAC mosaics of the bipolar system, where the images at 8, 4.5, and 3.6 μm are mapped in red, green and blue respectively. c) Gray-scaled color-inverted Spitzer/MIPS 24 μm image is overlapped with the contours of Bolocam 1.1 mm continuum emission. The intensity of the contours varies from 0.1 Jy/Beam to 0.8 Jy/Beam with 10 levels. The error ellipse of the IRAS point source (IRAS 18114-1825) is over-plotted on both panels. The magenta cross marks the central source of the system.
Current usage metrics show cumulative count of Article Views (full-text article views including HTML views, PDF and ePub downloads, according to the available data) and Abstracts Views on Vision4Press platform.
Data correspond to usage on the plateform after 2015. The current usage metrics is available 48-96 hours after online publication and is updated daily on week days.
Initial download of the metrics may take a while.