Fig. 4
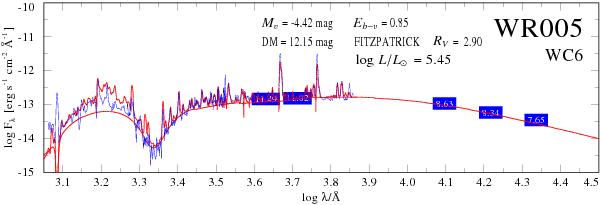
Spectral energy distribution (SED) for the WC6 star WR 5. Flux-calibrated observations (blue thin and noisy line) are from IUE in the UV, Torres & Massey (1987) in the optical, and 2MASS (J, H, and K photometry) in the near-infrared. The synthetic spectrum is plotted as a red thick line. The continuum-only model flux is also shown for comparison. The model that fits the normalized line spectrum best has been selected from the WC standard grid (T∗ = 79.4 kK, log Rt/R⊙ = 0.5).
Current usage metrics show cumulative count of Article Views (full-text article views including HTML views, PDF and ePub downloads, according to the available data) and Abstracts Views on Vision4Press platform.
Data correspond to usage on the plateform after 2015. The current usage metrics is available 48-96 hours after online publication and is updated daily on week days.
Initial download of the metrics may take a while.