Fig. 12
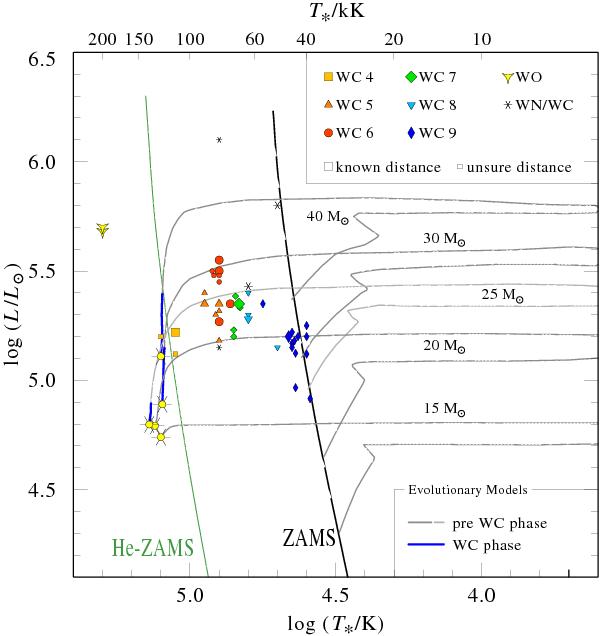
HRD with the WC star positions and the tracks (thick lines) from Vanbeveren et al. (1998) using higher mass-loss rates during the RSG phase. The track for Minit = 25 M⊙ is shown in light grey for clarity. In the WC phase, all tracks are drawn as thick dark/blue lines.
Current usage metrics show cumulative count of Article Views (full-text article views including HTML views, PDF and ePub downloads, according to the available data) and Abstracts Views on Vision4Press platform.
Data correspond to usage on the plateform after 2015. The current usage metrics is available 48-96 hours after online publication and is updated daily on week days.
Initial download of the metrics may take a while.