Free Access
Fig. 6
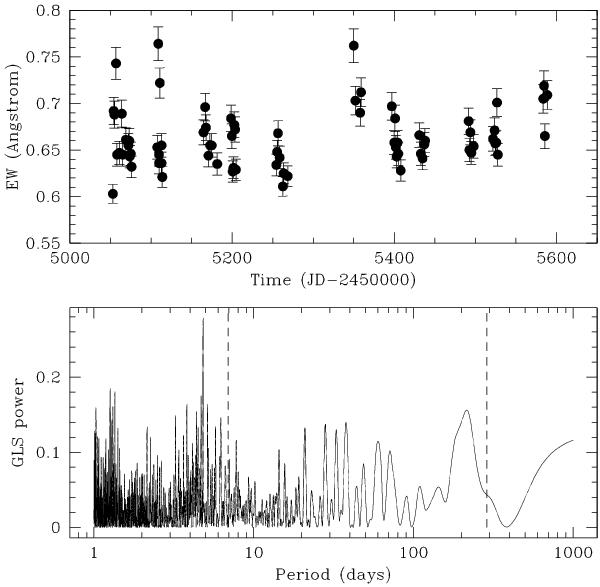
Upper panel: the measurements of Ca ii λ8662 EW variation. Lower panel: the GLS periodogram of Ca ii λ8662 shows a clear peak corresponding to a period of P = 4.82 d. The dashed line shows the period of the RV variations.
Current usage metrics show cumulative count of Article Views (full-text article views including HTML views, PDF and ePub downloads, according to the available data) and Abstracts Views on Vision4Press platform.
Data correspond to usage on the plateform after 2015. The current usage metrics is available 48-96 hours after online publication and is updated daily on week days.
Initial download of the metrics may take a while.