Fig. 6
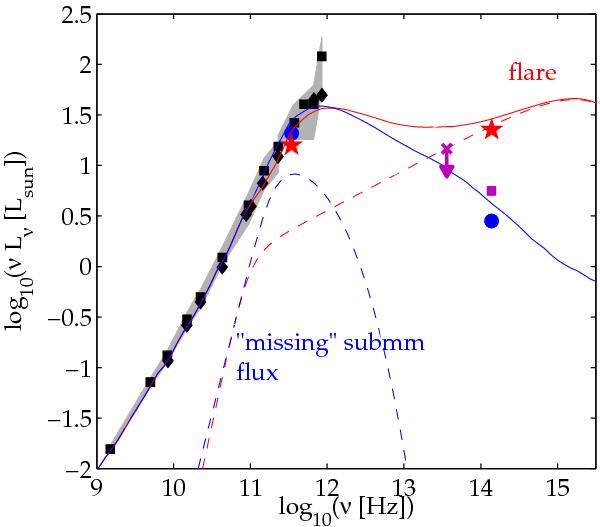
A model for an NIR flare with an accompanying sub-mm dip compared to the data from July 20 (see caption of Fig. 5). Compared to the sub-mm-radio SED shown in black square/diamonds, it can be seen that the flux of the sub-mm dip (red star) is lower than the typical sub-mm flux. The dashed lines show a toy model for the flare, in red, as well as for the “missing” sub-mm flux, in blue. The blue solid line shows the quiescent model of Yuan et al. (2003), and the red solid line represents the same model but with the “missing” sub-mm flux subtracted and the flare emission added. This particular figure shows the decreasing magnetic field case: to prevent overproduction of synchrotron emission from the accelerated population the magnetic field decreases from B = 30 G to B = 14 G. The spectrum for the case of the loss of electrons is very similar.
Current usage metrics show cumulative count of Article Views (full-text article views including HTML views, PDF and ePub downloads, according to the available data) and Abstracts Views on Vision4Press platform.
Data correspond to usage on the plateform after 2015. The current usage metrics is available 48-96 hours after online publication and is updated daily on week days.
Initial download of the metrics may take a while.