Fig. 3
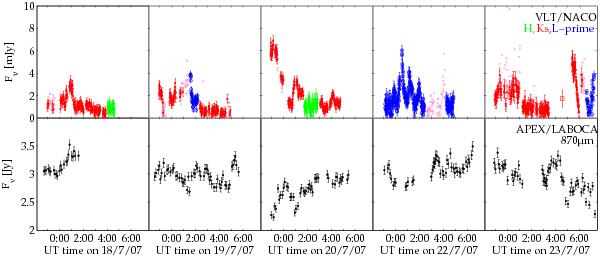
Lightcurves of Sgr A* at NIR and sub-mm wavelengths for five days of the July 2007 campaign. The green, red, and blue datapoints of the upper panels represent the H, Ks, and L′-band NIR fluxes, respectively. Light red squares show Ks-band observations for which max(FWHMx,FWHMy) > 15 pixels ( ≈ 200 mas). The sub-mm lightcurve is shown below in black. One should bear in mind that the NIR observations were not all made in the same filter.
Current usage metrics show cumulative count of Article Views (full-text article views including HTML views, PDF and ePub downloads, according to the available data) and Abstracts Views on Vision4Press platform.
Data correspond to usage on the plateform after 2015. The current usage metrics is available 48-96 hours after online publication and is updated daily on week days.
Initial download of the metrics may take a while.