Fig. 5
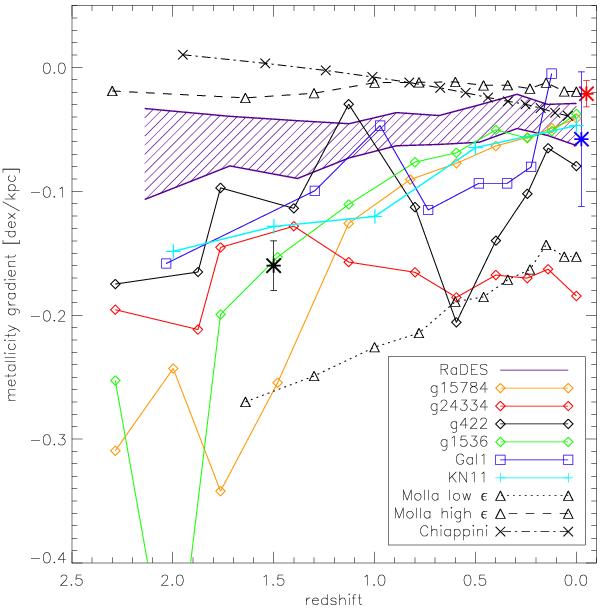
The derived radial [Z] gradient as a function of redshift. Here, we have used 11 different redshifts and measured the radial gradient of the young stars (stars formed in the last 100 Myr at each step) in the disk at that time. We examined the disks at each redshift, to determine the appropriate galactocentric radius over which to measure the gradients (see text for details). Four MUGS galaxies (g15784 (orange diamonds); g24334 (red diamonds); g422 (black diamonds); g1536 (green diamonds)) are shown, along with Gal1 (blue squares) from Rahimi et al. (2011), KN11 (cyan plus symbols) from Kobayashi & Nakasato (2011), and the 19 RaDES galaxies (denoted by the purple hatched area showing the region encapsulating 1σ of the gradients measured at a given redshift). The two chemical evolution models are overlaid for completeness: Chiappini (black dot dashed crosses), and Mollá high efficiency (black dashed triangles) and low effiency (black dotted triangles). The black asterisk corresponds to the result from one lensed grand design spiral at z ~ 1.5 (Yuan et al. 2011), the blue asterisk to the typical gradient inferred in nearby spirals (Zaritsky et al. 1994), and the the red asterisk to the typical gradient seen in interacting disks (Kewley et al. 2010); these latter local points are offset slightly at z = 0, for clarity.
Current usage metrics show cumulative count of Article Views (full-text article views including HTML views, PDF and ePub downloads, according to the available data) and Abstracts Views on Vision4Press platform.
Data correspond to usage on the plateform after 2015. The current usage metrics is available 48-96 hours after online publication and is updated daily on week days.
Initial download of the metrics may take a while.