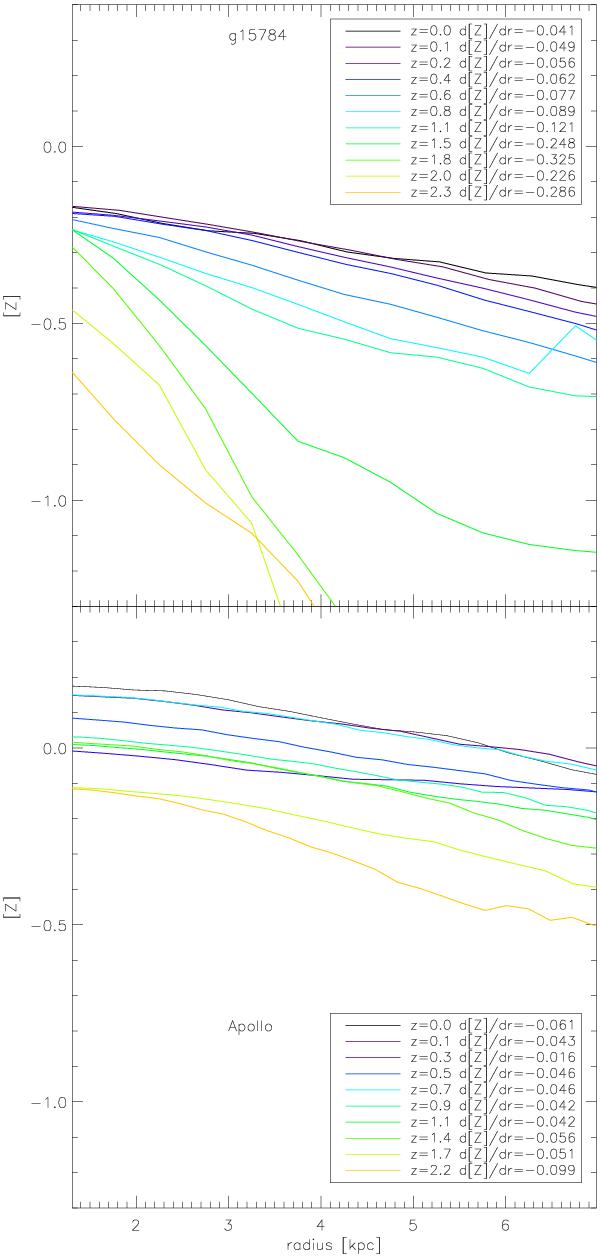
Fig. 4

The radial [Z] gradients of young stars in g15784 (top panel) and Apollo (bottom panel). The different colors correspond to different redshifts running from z = 0 (black) to z = 2.2 (orange), illustrating the time evolution of the abundance gradients in both simulations. Note the more dramatic flattening of the MUGS (g15784) relative to that of RaDES (Apollo). The fitted gradients were not done in an “automated” fashion; we examined each timestep’s surface density, kinematic, and abundance profiles, to take into account the growth of the disk and identify the “cleanest” disk region within which to determine the gradient.
Current usage metrics show cumulative count of Article Views (full-text article views including HTML views, PDF and ePub downloads, according to the available data) and Abstracts Views on Vision4Press platform.
Data correspond to usage on the plateform after 2015. The current usage metrics is available 48-96 hours after online publication and is updated daily on week days.
Initial download of the metrics may take a while.


